Check memory usage | LinuxGist
This article will provide few examples on how to check memory usage on Linux system. Finding memory usage details on a Linux systems can be a useful task for system administration.
Introduction
Finding memory usage details on a Linux systems can be a useful task for system administration and optimization. Linux provides a rich set of commands and tools that can provide comprehensive data about system memory usage at any given time.
In this tutorial you will learn:
- How to use common methods and commands to get detailed information about memory usage.
- Using memory tools for diagnosting system issues.
1. Using free Command
The free command provides a quick overview of the total, used, and free memory in your system.
1
free -h
-h: Human-readable format (shows memory in GB or MB).
Example output:
1
2
3
               total        used        free      shared  buff/cache   available
Mem:            31Gi        13Gi       3.3Gi       1.1Gi        16Gi        17Gi
Swap:          2.0Gi       8.5Mi       2.0Gi
Understanding free Command Output
The free -h command provides a human-readable format, making it easier to understand. Here’s what each column means:
- total : Total physical memory available on the system.
- used : Memory currently in use.
- free : Memory that is not being used at all.
- shared : Memory that is shared among multiple processes.
- buff/cache : Memory that is used for buffers and cache (both user-level cache and kernel buffers).
- available : The amount of memory available for starting new applications, without swapping.
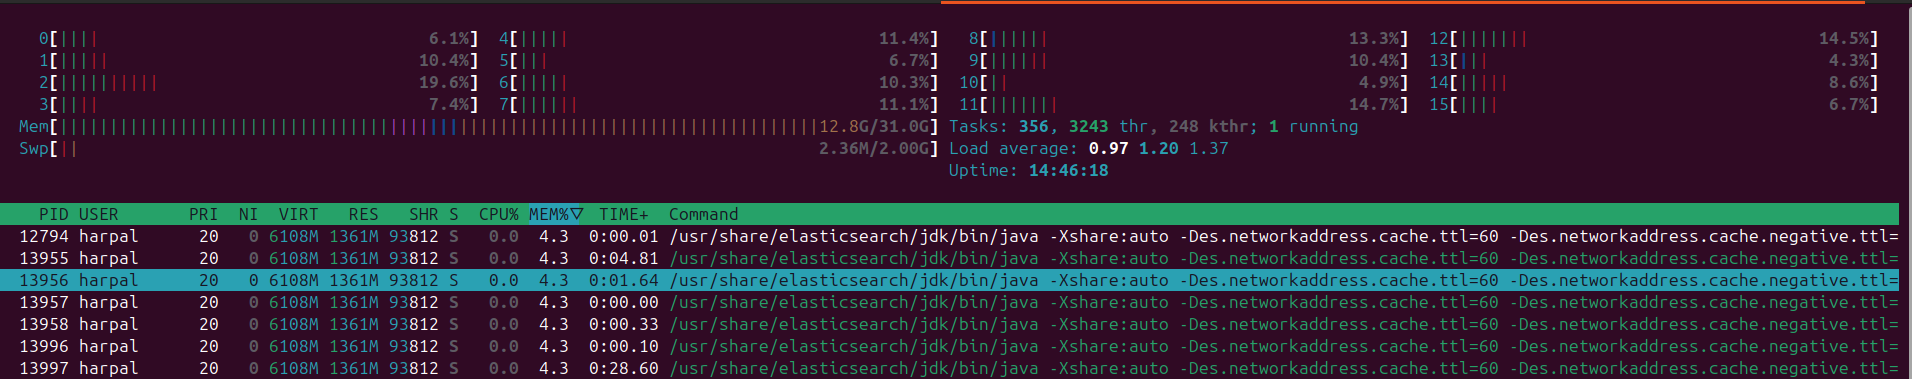
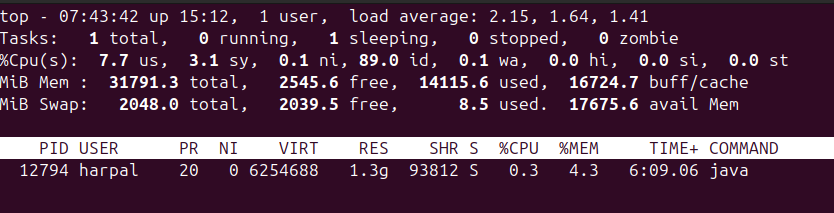
2. Using top Command
The top command provides real-time information about the system’s memory usage, including CPU and other resource utilization.
1
top
Look for the %MEM column for memory usage by processes.
To focus on memory-related details:
- Press
Mto sort processes by memory usage. - You can see a detailed breakdown of memory used by each process.
Example output:
1
2
3
4
5
6
7
8
9
10
11
top - 07:14:15 up 14:42,  1 user,  load average: 0.90, 1.35, 1.46
Tasks: 599 total,   2 running, 597 sleeping,   0 stopped,   0 zombie
%Cpu(s):  1.6 us,  1.4 sy,  0.0 ni, 97.0 id,  0.0 wa,  0.0 hi,  0.0 si,  0.0 st
MiB Mem :  31791.3 total,   3338.5 free,  13454.1 used,  16607.2 buff/cache
MiB Swap:   2048.0 total,   2039.5 free,      8.5 used.  18337.2 avail Mem

    PID USER      PR  NI    VIRT    RES    SHR S  %CPU  %MEM     TIME+ COMMAND
  12794 harpal    20   0 6254688   1.3g  93812 S   0.7   4.3   5:59.96 java
   3126 root      20   0 3535984   1.0g  14208 S   0.3   3.3   2:58.57 qemu-system-x86
   4129 root      20   0   14.6g   1.0g 427000 S   0.7   3.2   4:01.99 uvicorn
  17105 harpal    20   0   33.5g 922952 577432 S   1.3   2.8  22:14.96 chrome
3. Using htop Command
The htop command is an interactive version of top, providing a more user-friendly interface for monitoring system resources, including memory.
1
2
sudo apt-get install htop
htop
- This command will open an interactive display where you can see memory usage alongside other resource metrics like CPU and disk space.
4. Using vmstat Command
The vmstat command provides a snapshot of virtual memory statistics.
1
vmstat -s
This command will list various memory-related statistics, such as total memory, used memory, free memory, etc.
Example output:
1
2
3
4
5
6
7
8
9
10
     32554244 K total memory
     14016060 K used memory
     10391660 K active memory
     17072836 K inactive memory
      3120068 K free memory
      1025608 K buffer memory
     16009468 K swap cache
      2097148 K total swap
         8704 K used swap
      2088444 K free swap
5. Using cat /proc/meminfo
The /proc/meminfo file contains detailed information about the system’s memory.
1
cat /proc/meminfo
This command will display a comprehensive breakdown of memory-related statistics, including total memory, used memory, free memory, and more. When executed, cat /proc/meminfo reads from the /proc/meminfo file. This file contains various statistics about system memory that are collected by the kernel at runtime.
Example output:
1
2
3
4
5
6
7
8
9
emTotal:       32554244 kB
MemFree:         3100368 kB
MemAvailable:   18520176 kB
Buffers:         1026280 kB
Cached:         15364568 kB
SwapCached:         6288 kB
Active:         10417620 kB
Inactive:       17074168 kB
...
Example Usage Scenarios
Scenario 1: Monitoring Memory Usage During Boot
You can use these commands in a script to monitor memory usage during the boot process. For example, you might want to log memory usage every five minutes.
1
2
3
4
5
6
#!/bin/bash

while true; do
    free -h >> /path/to/memory_usage.log
    sleep 300
done
Example output:
1
2
3
4
5
6
7
8
9
               total        used        free      shared  buff/cache   available
Mem:            31Gi        14Gi       2.2Gi       1.2Gi        16Gi        17Gi
Swap:          2.0Gi       8.5Mi       2.0Gi
               total        used        free      shared  buff/cache   available
Mem:            31Gi        13Gi       2.6Gi       1.1Gi        16Gi        17Gi
Swap:          2.0Gi       8.5Mi       2.0Gi
               total        used        free      shared  buff/cache   available
Mem:            31Gi        13Gi       2.6Gi       1.1Gi        16Gi        17Gi
Swap:          2.0Gi       8.5Mi       2.0Gi
Scenario 2: Identifying Memory-Hungry Processes
If you suspect that a particular process is consuming an unusually large amount of memory, you can use top or htop to identify it.
1
top -p <PID>
Replace <PID> with the Process ID of the process you want to monitor. This will display detailed information about the specified process.
Scenario 3: Analyzing Memory Usage After a System Crash
If your system crashes, analyzing memory usage can help diagnose the issue. You might use commands like vmstat or /proc/meminfo to review memory usage just before the crash. These commands can be added in a shell script to take memory snapshot every few minutes and then anaylsed to see any unusual spike of momory or any trace of memory leaks.
Common Scenarios:
- High memory usage causing system slowdown.
- Memory leaks in applications.
- Insufficient swap space leading to excessive paging.
Conclusion
By using these commands and techniques, you can effectively monitor and manage memory usage on your Linux system and keep it healthy and optimized.